 ligo Heat Map
Getting Started
Rationale
Design and use of oligomers for PCR and hybridization is a common practice in molecular biology.
There are numerous softwares as well as web tools to design primers for a given DNA sequence, or sometimes
for a set of aligned DNA sequences (e.g. Primers 3,
Picky,
Primegens. See http://bioinfo.unice.fr/softwares/oligo_softwares.html).
There are numerous articles, well referenced in PubMed, containing sequences of primers described as specific of
a single sequence or a set of sequences.
The problem becomes more complex when one wishes to verify if a given oligomer (PCR primer, probe) hybridizes
well on more than a single sequence, such as a set of target sequences but not on a different set of closely related sequences.
The problem is that the presence of mismatches is not sufficient to estimate that the Tm has significantly decreased due to some mismatches within the duplex.
This problem led to the NearestNeighbour algorithm now in use by modern primer calculating softwares like
Melting (Le Novere, 2001) or DNAmate (Panjkovich, 2005).
We therefore are in need of a tool that accepts a set of primers and a set of sequences, and provides information on which primer is specific of which sequence.
Also, it would be nice to be able to combine such estimate with a presentation of the sequence data set as a phylogenetic tree, since primer specificity
may be related to a particular group of related sequences.
Finally, we want the results to be nicely displayed, hopefully easy to analyse quickly, on an image for example.
Requirement
Oligo Heat Map is a web-application (Javascript,Php), a simple web-browser with an internet connection is needed to use it.
If you wish to install OHM on your own server, a web server supporting Php is required (see INSTALL notes).
Input data
° you have to provide at least one oligomer's sequence.
° you can provide a set of aligned sequences, at least one of them contains the primer(s)
(see "How to align your sequences ?").
Sequences can be enter manually (one per line) or imported from a file.
The format of the file can be clustal, fasta, mase (seaview) or tabulated format.
Output data
There are 2 types of outputs:- The button "View alignments"; will display information related to the position of the oligomers within the data set of aligned sequences (if it exists) as well as information for a given amplicon.
- The button "View Tm"; will display information about the Tm of each oligomer, as well as images on how each oligomer will hybridize on each sequence of the alignment provided.
Data generated can be downloaded as files.
Description
Primers/Probes box
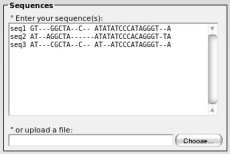
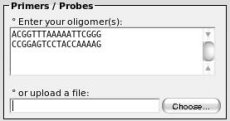 ° Enter your oligomers in this box. You can add one or more oligomers; one oligomer per line.
Type your nucleotidic sequence without any blank character.
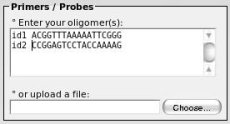 ° If none is provided, an identifier will be automatically generated for each oligomer.
 To add your own identifier, enter: id 'space' oligo as shown on the left.
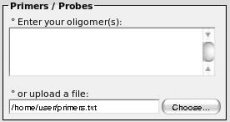 ° If you want to import oligomers from a file, simply click on the "choose..." button and select your file.
Many formats are supported like clustal, fasta, mase (seaview), or tabulated format
If there are primers into above field ("manually enter" box), the file will not be uploaded.
Sequences box
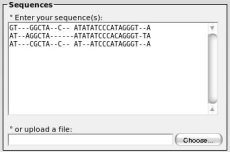 ° Proceed as above. You can add none, one, or many sequences, one sequence per line. Sequences have to be aligned because the tool will
extract areas corresponding to positions where an oligomer was exactly found (see. "How to align your sequences ?").
° Proceed as above. You can add none, one, or many sequences, one sequence per line. Sequences have to be aligned because the tool will
extract areas corresponding to positions where an oligomer was exactly found (see. "How to align your sequences ?").Note that if you have not entered any sequence, the results will show only oligomers hybridizations on itself (dimers of primers) and hybridization on invert-complement (primer on target).
Type your nucleotidic sequence without any blank character (indel should be "-").
 ° If none is provided, an identifier will be automatically generated for each sequence.
 To add your own identifier, enter: id 'space' sequence as shown on the left.
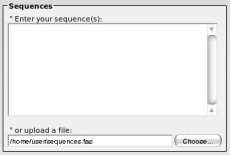 ° If you want to import sequences from a file, simply click on the "choose..." button and select your file.
Many formats are supported like clustal, fasta, mase (seaview), or tabulated format
If there are sequences into above field ("manually enter" box), the file will not be uploaded.
Options box and links
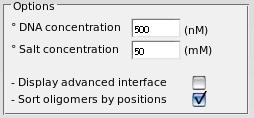
° You can adjust DNA and salt concentrations for a more precise melting temperature calculation.
° You can display advanced interface (see below).
° You can sort the set of oligomers by using their positions along the sequences.
There are two other links. Reset forms: reset all entries and reload page. Help: this help.
Advanced interface
Change the interface and add 2 more lists, one into the oligomers box and one into the sequences box.
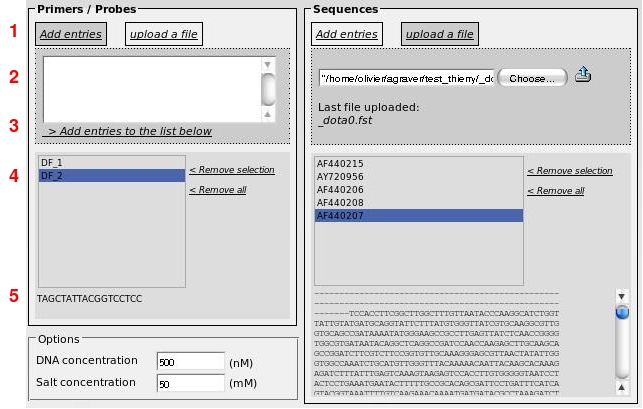
(1) First, you have to choose "Add entries" or "upload a file".
(2) If you want to add primers or sequences manually, use the text box exactly as in the simple form described above. If you wish to upload a file, click on "Choose" button and select a file.
(3) Once you have entered your primers (or sequences), click on "Add entries to the list below". You can add your sequences successively from different files.
(4) Display the list of primers or sequences. Identifiers are shown in these lists. You can remove a selection from a list or remove all of them.
(5) If an identifier is selected from a list, the corresponding sequence is displayed.
Once the 2 lists are completed, you can do your analysis ("View alignments" and "View Tm"). Sequences contained in the lists will be used for the calculation.
View Tm
This will compute thermodynamical values and Tm.Once you have completed the form, click on "View Tm" button, results are shown in tables.
The process may take some times, while the script is running. If a warning message of your browser appears, you may have to click on button "continue".
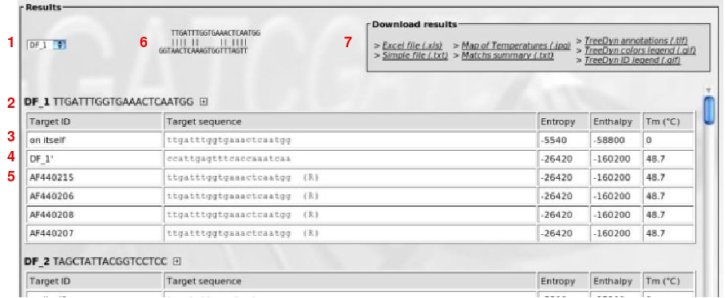
(1) Drop-down list to select an oligomer for quick jump to result.
(2) Active oligomer with: identifier, oligomer's sequence, and a 'plus' image. If you click on this image, a new window is displayed which shows Tm computed by the DNAmate software.
(3) This line shows thermodynamical values (enthalpy, entropy and melting temperature), for the oligomer on itself
(4) This line shows thermodynamical values for the oligomer on target (exact invert-complement sequence)
(5) Following lines show thermodynamical values for oligomer on each sequence (including mismatches). If an 'R' appeared, it means that the oligomer was found in invert-complement sequence.
(6) Representation of oligomer hybridization. Move you cursor over sequences lines to display hybridizations.
(7) Files containing the results to download.
Notes: The melting temperature (Tm) is calculated using the nearest-neighbour method and the thermodynamic data published by SantaLucia in 1998.
The salt correction method used (to adjust the Tm from 1M NaCl departure) is based on Wetmur in 1991 (see Melting help page for detailed
comparisons of corrections, here)
Because the goal of OHM is not to precisely calculate the Tm, we strongly encourage to have another estimation of Tm by using other tools like Melting
(Le Novere, 2001) or DNAmate (Panjkovich, 2005).
Note that a link is provided in OHM results (small cross) to open online DNAmate tool.
The following files can be downloaded:
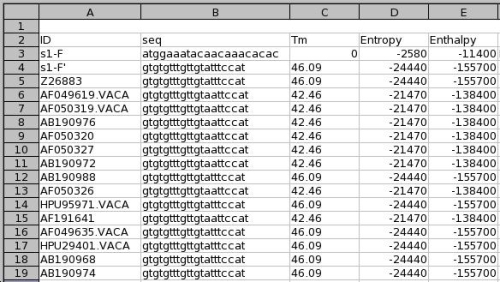
A - Excel file
An excel file which details for each primer the predicted Tm on each sequence.
e.g.:
B - Text file
The same data but as a simple text file in tabulated format (for non MS office users).
C - Pdf file
The same data but as a pdf file.
D - Map of Temperatures (.jpg)
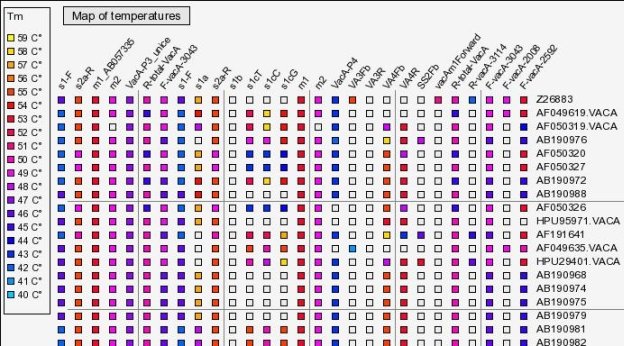
An image file that displays a map of Tms. For each oligo and each sequence, it shows the predicted Tm as colored coded squares (i.e. a HeatMap).
Example of such heatmap:
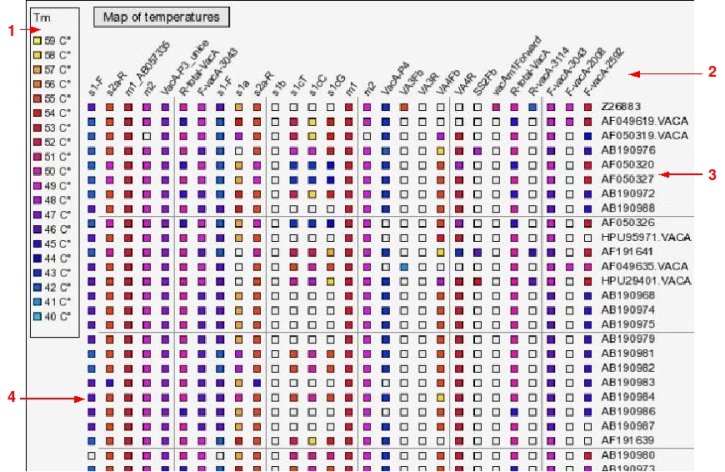
(1) Legend to show correspondences between colours and Tms
(2) Identifiers of oligomers
(3) Identifiers of sequences
(4) The Tms represented by colored squares
E - Map of Temperatures (.pdf)
The same heatmap image but as a pdf file.
F - Matches summary
A summary of the data. A table which provides a easy to use overview for design of degenerated primers. For any given primer, it shows how many degenerated positions are
necessary to match every sequences. It also shows how many sequences match a given primer, or primer with mutation. e.g.:
G - TreeDyn files
Images and annotation files for TreeDyn (see www.treedyn.org)
* An annotation file allowing to paste the heatmap in regard of each sequence within a phylogenetic tree.
* A .gif image which provides the relationships between heatmap color code and Tm in °C.
* A .gif file which provides the relationships between heatmap column number and primer's name.
(see "Howto" for more details)
View alignments
Once you have entered one or more primers and at least one sequence, you can click on "View alignments" button.
This will show oligomers positions on a sequence consensus. A set of aligned sequences is needed to process.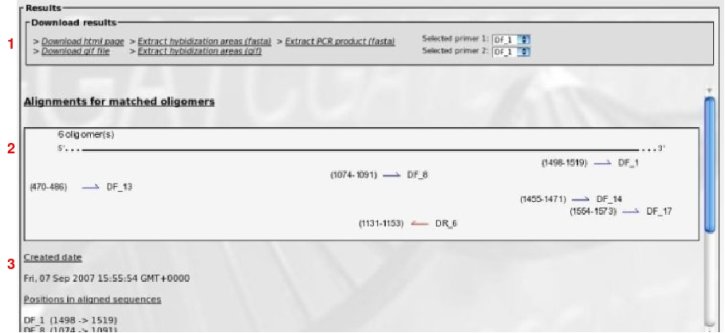
(1) Results files for download.
(2) A graphical summary of oligomers positions along the consensus aligned set of sequences is shown. Each arrow represents an oligomer with positions in brackets and identifiers on the right. Blue arrows for forward primers and red arrows for reverse primers.
(3) Some text informations is displayed: date of the analysis, positions of primers along sequences, primers without any match (if any exists).
Now, let's have a look on the files for download:
A - HTML page
An html page which represents the positions of primers with sequences as described above (you have to save html and gif file in the same directory).
B - Hybridization area (gif)
An image (gif) that shows a given oligomer as well as the domain within aligned sequences that contains it.
This allows to check that sequences are properly aligned within this domain. Before download, you will prompted for the numbers of positions to include
on the right and on the left of primer's location.
C - Download page (pdf)
The page of results and image of hybridization area can also be downloaded as a pdf file.
D - Hybridization area (fasta)
The same information can be obtained as a fasta file for download. You can then open it in you favourite sequence editor.
e.g., image generated with Seaview software using the OHM fasta file:

E - PCR product
Next, you can download a fasta file corresponding to the PCR products generated by a couple of primers selected in the form. This fasta file contains products for every
sequence contained in the alignment.
The selection of the couple of primers is facilitated as their positions in sequences are visible on screen.
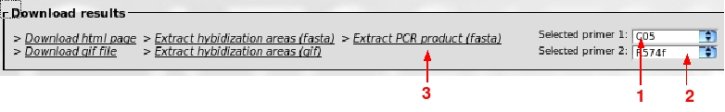
Primers C05 and R574f, which seem properly suited have been selected with the drop-down lists (1 and 2) and a click on
"Extract PCR product" (3) will download the appropriated fasta file.
HowTo
How to use with a single primer?
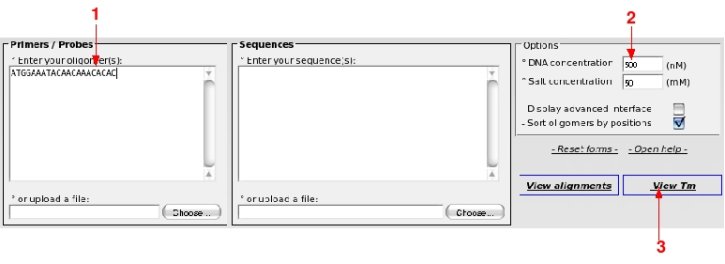
Lets say you want to analyse the following sequence : ATGGAAATACAACAAACACAC
Open OHM at http://bioinfo.unice.fr/ohm/You are viewing the main page. Enter the sequence of the oligo in the box shown by the red arrow (1).
Note that you can add and identifier to you primer sequence. e.g.: 1 ATGGAAATACAACAAACACAC . It is not required but reading will be easier when you paste several oligos. If not provided, OHM will generate unique identifiers.
If necessary modify the DNA and Salt concentrations to fit you planned experiment (2).
Click on "View Tm" (3)
Which results in :
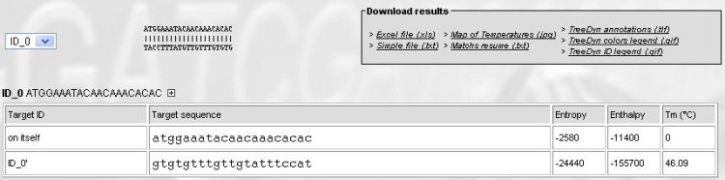
There is a single sequence to analyse, the only interesting informations are:
- The predicted Tm for dimers of primers (on itself line => no dimers, since Tm=0)
- The predicted Tm for primer on its exact target, ID_0 line (oligo's name created by OHM) => Tm 46 °C
Click on the boxed + on the right of oligo's sequence, will send informations to dnaMATE web server, and provides estimates of Tm calculated using several alternate algorithms. Example :
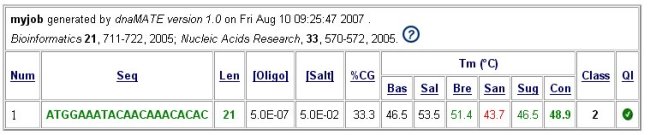
Please refer to explanations on dnaMATE website.
How to process with many data ?
In this example we want to analyse some primers published to identify Helicobacter bacteria.° The data set
We want to check primers retrieved from the literature and that are described as fit to amplify the vacA pathogenicity genes from the bacteria Helicobacter.Primers sequences from pdf articles were copied into a text file : published_primers.txt (the following example, we used 30 primers. This downloadable file contains only 7 primers in order to compute faster).
Using a tool like SRS or Acnuc, we have also retrieved the almost complete gene sequences for this study. We have aligned them by hand, because alignment tools such as Clustal or Muscle do not produce correct alignments (they introduce indels within codons, and they do not properly align very divergent domains present in these sequences).
The alignment in fasta format is in file long_vaca_aligned.fas. There are 89 sequences.
° Load the data sets into OHM
We will load these 2 files into OHM. Loading the alignment file may take some time because it is a large file.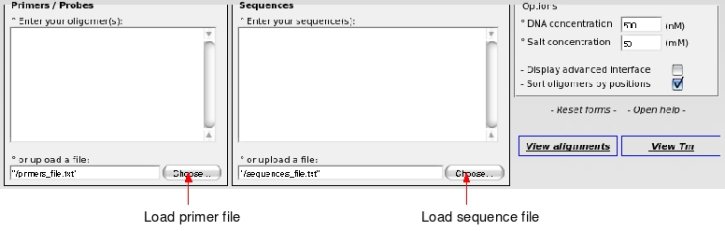
Now, all data have been uploaded and you can start analysis.
° View alignments
Click on the "View alignments" button on the right. Since there are many primers and many long sequences, it takes time.
Depending upon the settings of you web browser, you may get a warning. Click "continue this script" if it is the case (if you do not click, calculation will not be completed).
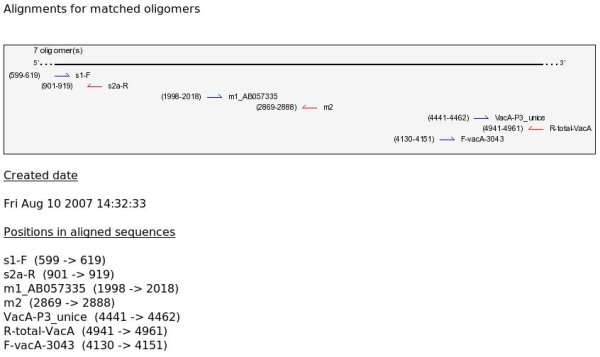
When calculation is done, you get the following results:
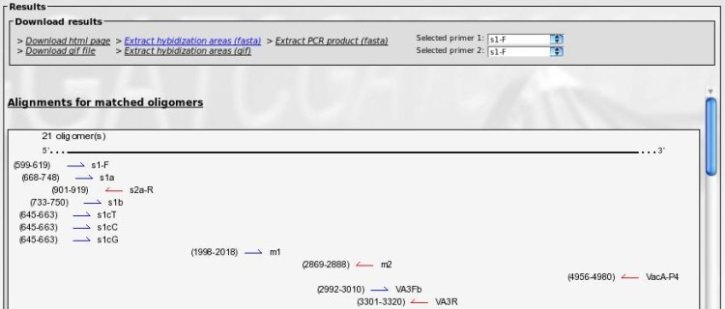
The top frame allows for file download (see "Description" chapter for more informations).
The bottom frame contains an image of each primer location, with the positions in alignment and strand orientation.
Primers are shown in the order they appear in input file or sorted by positions if you have selected this option. You can scroll up and down.
Below is the list of primers that were not found in the aligned sequences (if any).
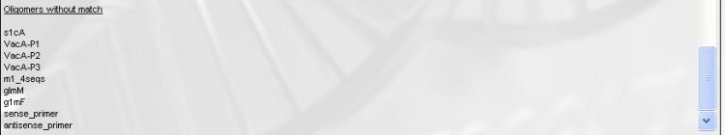
Going back to the publications shows that these primers were copied by error. However, it is simpler and quicker to simply copy every primer found in the pdfs and let OHM do the screening instead of reading the entire pdf to find out which primer should be copied.
The top frame allows to download a series of useful files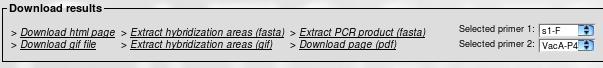
- "Download html page" and "download gif file" will allow you to download on your computer the two files that save present results. Alternatively you can save the entire web page and figure as a pdf file (Download page (.pdf)).
- "Extract hybridization areas (fasta)" and "Extract hybridization areas (gif) will work for the primer selected in the Upper Drop-Down List ("Selected primer 1").
This will produce a fasta file or an image with the primer sequence, the corresponding domain in each sequence and a number (you are asked for)
of nucleotides to extract from both sides. This is very useful to rapidly check that sequences are well aligned for each primer position. It also allows for a rapid visual
check of the number of mutations for each primer (see "description" chapter for more details).
(full file here )
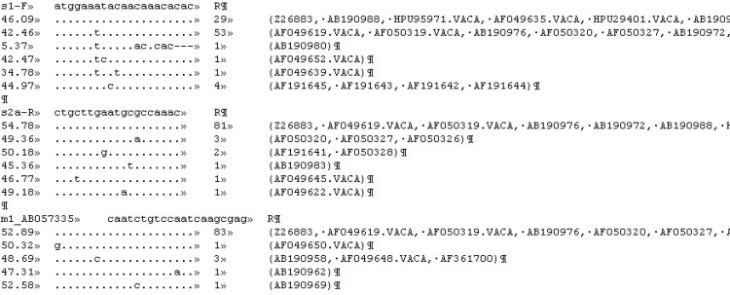
Extraction of domain for primer s1-F, showing:
. A large number of sequences start exactly with the primer. This suggest that these sequences were probably amplified with this primer, as a result we cannot
believe the exact match predicted !
. One of the sequences has an indel and is not properly aligned.
- "Extract PCR product (fasta)" will use the two primers selected in the drop down lists ("Select primer 1" and "Select primer 1") and will extract these two primers as well as the PCR product produced. Useful for a rapid analysis of PCR products sizes and possible differences in lengths and compositions.
° View Tm
Click on "View Tm". After a time of calculation, you get the following form: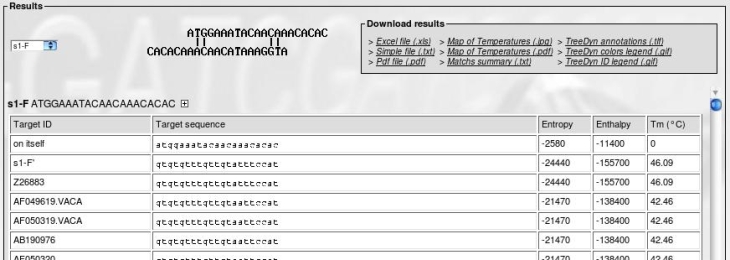
The top frame is for files download (explained in "Description->Tm" section).
The bottom frame provides:
- The name and sequence of a primer
- The Tm of primer on itself (dimer of primers)
- The Tm of primer on its exact target (invert complement of sequence)
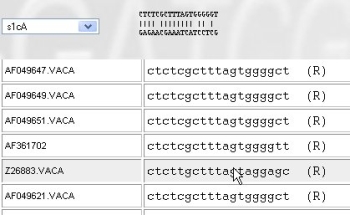
- For each sequence in alignment, the predicted Tm, the target sequence and a "(R)" if the real target sequence is the invert complement of the sequence in the alignment.
Use the drop-down list to jump to a different primer. Browse with the mouse over a target sequence to see how the primer hybridizes to the target.
There are different ways to get results:
- "Excel file (.xls)" and "simple file (txt)" allow for a download of these complete results either in xls format for Excel or in a tabulated format.
- "Map of temperatures (.jpg)" download a jpeg file (heatmap) with a color representation of how each primer will hybridize to each target sequence.
- "Map of temperatures (.pdf)" same heatmap as before, but image is downloaded as a pdf file.
- "Match summary" provide a summary file of these results. Useful for design of degenerate primers.
- The files for TreeDyn are explained in "How to export results to Treedyn ?"
example of results:
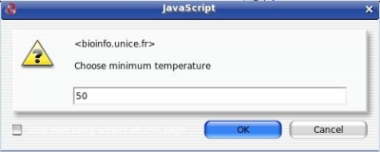
- "Map of temperatures"After a click on "Map of temperatures", you are asked for a minimal Temperature in °C. OHM will map each predicted temperature provided it is above this threshold.
On the heatmap below, the maximal Tm found was 59°C. Tms between 59°C and 40°C (the answer we provided) are color coded between light blue and yellow. Each primer is represented by a specific column and each sequence by a row. There are grey squares when the Tm is below the threshold and white squares when there is no corresponding domain (short sequence).
(full file here )
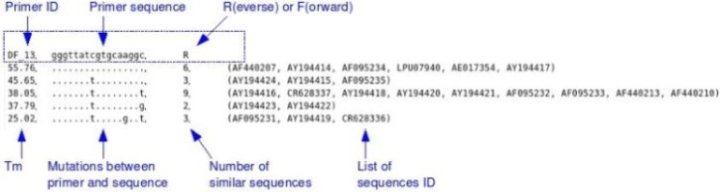
- Match summary (.txt)
Allows to download a file that looks like:
For each primer, you get the name and sequence of this primer, and a number of lines that provide :
. The predicted Tm
. The target sequence , with "." for positions with a perfect match, a letter when there is a mismatch and a '-' an indel.
. The number of such sequences in alignment
. The list of their identifiers in alignment
It is very easy to see that the first primer is not very good and that the following primers are probably better but that we should probably go for degeneracy.
Notices:
- You can go back and forth between "View alignments" and "View Tm" without redoing calculation simply click on "cancel" in the message box.
- You can reload a new set of primers and keep the alignment file.
- If you change both, it is advised to use the "Reset all" link at the top of the present form.
How to export results to Treedyn?
Treedyn is a powerful tool for trees representations (www.treedyn.org). OHM is able to create annotations for a tree (generated with the same data set). These annotations contain the computed Tm as a colored representation that TreeDyn can use.The steps are:
(1) Create your tree by using any phylogenetic method and your sequences set, then display it with Treedyn software.
(2) Compute Tm for your oligomers with OHM (with the same sequences set as previously)
(3) From OHM results box, import treedyn annotations and legend files.
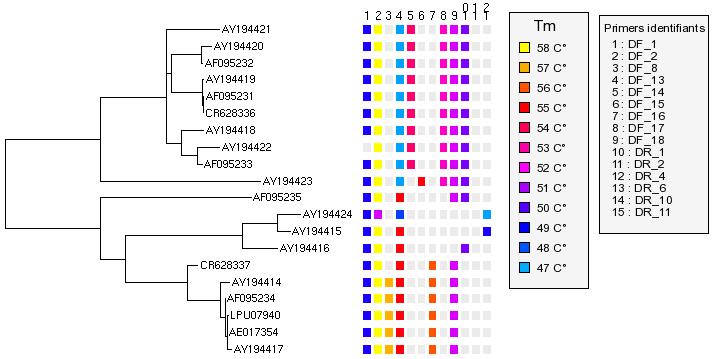
(4) Use these files to annotate your tree. The Tm are represented with colored squares (yellow for hight Tm and blue for lowers). Squares are shown on the right of each corresponding sequence in the tree, one column for each primer.
- The goal is to have an easy overview of primers efficiency against sequences. A phylogenetic tree can be represented in a nice way by using
TreeDyn software (Chevenet F et al., 2006). TreeDyn accepts .tlf files which contain data to annotate each leaf of the tree.
Main steps to obtain a tree are:
- Get your set of sequences (from a Blast, SRS, Acnuc, etc...)
- Align the sequences with Clustal (or whatever program you like best). Do not forget to check the alignment manually, this should improve your analysis.
- Extract domain common to each sequences (with a sequence editor like Seaview)
- Create a tree for example with Dnadist, NJ program, Dnaml or Dnapars. For example, get here a small tree
- Load the tree file into TreeDyn. - In OHM, enter the primers you want to test and the sequences set previously defined. Then, calculate Tm by clicking on "View Tm". All process are described in the previous "howto". (e.g. primers files, sequences file)
- There are 3 files you have to download from the OHM results box.
- "TreeDyn annotations (.tlf)" is the file to annotate your tree with computed Tm. Tm are changed into colors for an easier visualisation.
- "TreeDyn colors legend (.gif)" is a legend (a gif file) to show correspondences between colors and Tm values.
- "TreeDyn ID legend (.gif)" is a legend to associate your primers identifiers and the column numbers displayed by Treedyn.
Download each of these files on your computer. A pop-up will ask you the minimal temperature. Only the melting temperatures over the value will be shown.
(e.g.: annotations, colors legend, ID legend) - Colored Tm in association with the phylogenetic tree allows you to quickly see if a primer will hybridize on a cluster of sequences or if a specificity problem exists.
- Open your tree into TreeDyn software (it is recommended to have the latest TreeDyn version)
menu-> File -> Load tree(s)
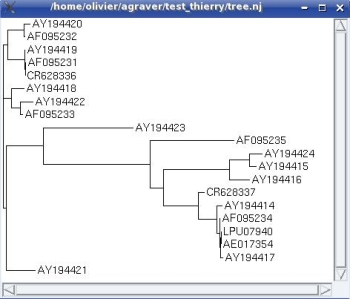
This is the image of loading the .nj file into TreeDyn : sequences are identified by their accession number.
- Select annotations to add to your tree
menu -> view -> annotations panel
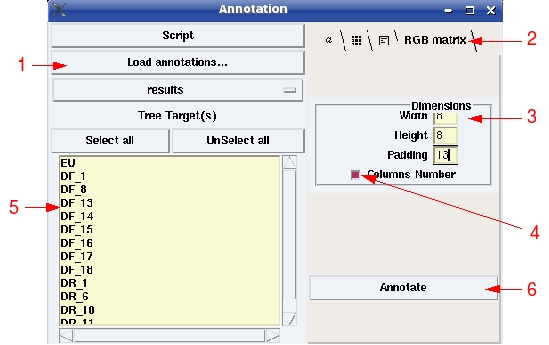
(1) Load annotations file; (2) select "RGB matrix"; (3) change dimensions values, optional; (4) Check to display columns number; (5) Select primers you want to see on tree; (6) Click to add annotations.
- Add legends (or any gif files)
Right click on the tree -> Add gif file -> select legend files (colors and primers identifiers)
How to align sequences ?
OHM asks that the input sequence should be aligned. There are many ways to align a set of sequences.
First, you have to get sequences into a file (fasta format).
Then, you can use a sofware as Clustal or Muscle to align your set.
Finally, you have to refine your alignment manually by using a sequence editor as Seaview (
ftp://ftp.ebi.ac.uk/pub/software/seaview/) and save your file into the fasta format for example.
You can use standalone or on line alignment tools:
° Download Clustal for your OS from ftp://ftp.ebi.ac.uk/pub/software/clustalw2/,
use either Clustalw (command line) or ClustalX (graphical interface) to align your sequences (use the slow option, default). Aligned sequences
are in the .aln file which OHM can use
° Download Muscle from http://www.drive5.com/muscle/download3.6.html,
align your sequences and save alignements in for example aligned.fst.
° Go to EBI, to use Muscle on line (http://www.ebi.ac.uk/muscle/) or Clustal on line (
http://www.ebi.ac.uk/Tools/clustalw2/index.html).
Load the file of sequences or paste them in the appropriate box, hit the Run button. Wait for the answer to appear. Save the alignment
file in text format. Upload this file in OHM.
Other
Troubleshootings
° During long computings, my browser opens warning pop-ups
The problem often appears with the Firefox browser because it thinks that there is a security problem. Try to change your browser security options or click on "continue".
° Gif files are not generated and I have got a warning message (local install of OHM)
The server of OHM is not properly installed. The "tmp" directory has to be read/write enable (see README.TXT)
° The interface seems to have displays problems
OHM uses CSS 2.0 and Javascript. Your web browser may be too old. Try to update it.
Contacts
Report any questions, comments, suggestions or critics to:
Laboratoire de Biologie Virtuelle, Centre de Biochimie
CNRS UMR 6543
Université de Nice Sophia-Antipolis - Parc Valrose
06108 Nice - France
http://bioinfo.unice.fr
Licence
This software is distributed under CeCILL licence (compatible with the GNU General Public License).
This software is governed by the CeCILL license under French law and abiding by the rules of distribution of free software. You can use, modify and/ or redistribute the software under the terms of the CeCILL license as circulated by CEA, CNRS and INRIA at the following URL "http://www.cecill.info".
See full licence here